
Model-Driven Telemetry into the TIG stack
Using the TIG stack to consume and visualize MDT
In this post I’m going to cover model-driven telemetry. I’ll first define it and give some explanation of some of the details, then I’ll describe the software stack you’d need to consume and visualize the telemetric data. I’ll also walk through a lab I built recently. I’ll show how to configure MDT on IOS-XE, how to (not) set up a TIG stack on Ubuntu, and how to get the data into Grafana for easy visualization.
Model-driven Telemetry
Model-driven telemetry or MDT is streamed or polled operational data from systems structured by a certain data model. Streamed data is emitted from a system and transported to a receiver either when something changes or at an interval. Polled data is retrieved by a receiver from a system at an interval. A data model describes how data is represented and accessed.
In more concrete terms, the data models used for MDT are YANG data models. YANG is a data modeling language used to model configuration and state data on network systems. Refer to RFC 6020 for the details. The transport mechanisms for MDT are typically raw TCP or gRPC (HTTP/2). They can both be wrapped in TLS. The data is encoded in Google protocol buffers.
The system emitting the streaming data is called a publisher. The system consuming the data is called the receiver. The system establishing the subscription is called the subscriber. And finally, the system that creates subscriptions but doesn’t receive them is called a controller.
For streaming sessions there are a few options: dial-in and dial-out. With a dial-in, sometimes called dynamic, session the receiver initiates the session and the publisher pushes the data to the receiver. With a dial-out, sometimes called configured, session the publisher opens the session and pushes the data to the receiver. Dial-out is similar to the publisher and subscriber pattern. The receiver of the data (or another system) tells the publisher of the data to stream data to the receiver at an interval or on change.
NETCONF is used for dial-in sessions and gRPC is typically used for dial-out sessions.
Consuming, Storing, and Showing Data
Recently, I was labbing MDT and I had to pick the software to consume the data coming from some network systems. I read through a number of docs on different stacks that do collection, storage, and visualization of streaming data. On my shortlist was ELK and TIG. Looking through some blogs and the Telegraf docs I found that there is an input plugin for MDT. This plugin sold me on building my lab with TIG.
The TIG stack is made up of Telegraf, Influxdb, and Grafana (TIG). Telegraf is a collection and processing engine for metrics. It’s very powerful and has wide support. Influxdb is a time series database. Grafana is an analytics and visualization front end. When these components are wired together they are very useful for operational data.
In the next sections I’ll detail a lab I used to demo MDT and the TIG stack. The code is in a repo in the resources section and has scripts to setup the TIG host on Ubuntu and configure a network device for NETCONF and MDT subscriptions.
I hosted my lab on Cisco Modeling Labs or CML. It allows drag and drop or API-based lab creation. There’s a management network, which all nodes in the lab connect to on their first NIC. This network is to access the lab nodes from my laptop. There’s also a transport network, which all nodes connect to on their second NIC. This network is meant to carry the telemetry data from publishers to receivers.
Lab Environment
In my demo lab we are running TIG and a CSR1000v on Cisco Modeling Labs (CML). There is an example topology file in the repo to get you started (topology.yaml). To generate an Ansible inventory from our CML lab, we can use cmlutils. It’s a great utility when working with CML.
A prerequisite to generating an Ansible inventory is to have nodes tagged. The tag cmlutils is looking for is ansible_group=GROUP_NAME, where GROUP_NAME is the name of the host group you want to put the node in. In this lab, I chose routers for network devices and tig for tig hosts.
To generate an Ansible inventory, use this command:
cml generate ansible
In the lab, we’re going to configure MDT on the CSR to stream CPU utilization and interface data to our TIG stack. We also have to configure Telegraf to use the Cisco MDT input plugin.
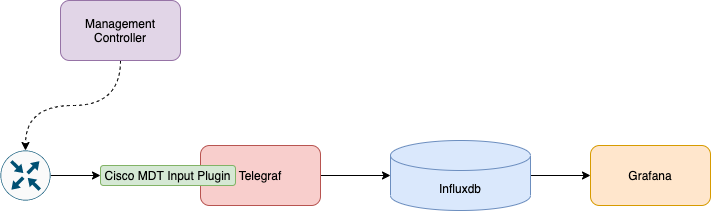
Telegraf is our receiver. The CSR1000v is our publisher. My laptop is the management controller.
Model-driven Telemetry Configuration
Configuring MDT is straightforward and in this example I’m going to demonstrate the process on a IOS-XE (CSR1000v). I’m going to use two methods to configure MDT: CLI and NETCONF.
We don’t want to have to poll the device or even dial-in for data to be streamed back on-demand. We want the network device to stream data on an interval to our receiver. So, we’re going to use the dial-out method on IOS-XE.
For CLI, configuring MDT looks like this:
telemetry ietf subscription <ID>
    Stream yang-push
    Filter xpath <xpath>
    Update-policy on-change | periodic <centiseconds>
    Encoding encode-kvgpb
    Source-address <IP address>
    receiver ip address <ip-address> <receiver-port> protocol <protocol>
A few callouts from the configuration:
We are pushing telemetry from the publisher (our router) to the receiver (TIG stack). Subscribers do not have to poll or dial-in to receive the stream.
The XPath argument is the path notation to reach the particular leaf in the YANG model you want to stream telemetry about.
Encoding in our case is going to be key-value pairs encoded with Google protocol buffers (protobuffs, gpb).
The transport protocol we’re using is grpc-tcp. This is gRPC over TCP, which means it is not encrypted with TLS.
For NETCONF, the edit-config RPC looks like this:
<config>
  <mdt-config-data xmlns="http://cisco.com/ns/yang/Cisco-IOS-XE-mdt-cfg">
    <mdt-subscription>
      <subscription-id></subscription-id>
      <base>
          <stream>yang-push</stream>
          <encoding>encode-kvgpb</encoding>
          <source-address></source-address>
          <period></period>
          <xpath></xpath>
      </base>
      <mdt-receivers>
          <address></address>
          <port></port>
          <protocol>grpc-tcp</protocol>
      </mdt-receivers>
    </mdt-subscription>
  </mdt-config-data>
</config>
Now we can run our Ansible playbooks to create, show, and delete MDT subscriptions. The scripts we’re going to run will create MDT subscriptions for CPU utilization and interface stats.
foo@bar:~$ ansible-playbook -i YOUR_INVENTORY set_mdt_cpu_util.yml

foo@bar:~$ ansible-playbook -i YOUR_INVENTORY get_mdt_configl.yml

foo@bar:~$ ansible-playbook -i YOUR_INVENTORY delete_mdt_cpu_util.yml
foo@bar:~$ ansible-playbook -i YOUR_INVENTORY set_mdt_intf_stats.yml

foo@bar:~$ ansible-playbook -i YOUR_INVENTORY get_mdt_configl.yml

foo@bar:~$ ansible-playbook -i YOUR_INVENTORY delete_mdt_intf_stats.yml
This is the MDT configuration Ansible playbook as an example of how these playbooks work:
---
- name: Configure MDT for CPU Utilization
  hosts: routers
  connection: netconf # We're using the ansible.netcommon NETCONF module plugins netconf_config and netconf_get
  gather_facts: no

  vars:
    ansible_netconf_host_key_checking: no
    sub_id: 505 # We choose this ID for later reference
    period: 500 # 500 centiseconds
    xpath: /process-cpu-ios-xe-oper:cpu-usage/cpu-utilization
    receiver_ip: 198.18.1.12 # Static address of TIG server
    receiver_port: 57000
    source_ip: ""

  tasks:
    # We have to know the source address of the network device first
    - name: Get Source Lab IP Address
      netconf_get:
        # XML filter to get IPv4 interfaces
        filter: <interfaces xmlns="http://cisco.com/ns/yang/Cisco-IOS-XE-interfaces-oper"><interface><ipv4/><name/></interface></interfaces>
        display: json
      register: results
    # Record the address for the second NIC and set as var
    - name: Record Lab IP Address
      loop: ""
      when: item.name == "GigabitEthernet2"
      set_fact:
        labip: ""
    # Use RPC template to configure MDT
    - name: Configure MDT
      netconf_config:
        target: running
        src: templates/set_mdt_rpc.xml.j2
There are playbooks in the repo to set the NTP server on the router, as well. This is a pretty important step as the router is streaming timestamped data to telegraf. This is a basic requirement of traditional logging systems, as well.
If you want to see the NETCONF configuration done using ncclient directly, take a look at this repo here.
Setup the TIG stack
Setting up a TIG stack is very easy. It’s so easy, in fact, you don’t even need to know how to actually do it. You can just use an Ansible playbook to perform all of the work for you. If you want to see the manual steps, there are many tutorials on the internet.
Check out my repo in the resources section to see an example of a playbook that provisions the stack (setup_mdt_lab_tig_host.yml). In that playbook, I am also adding dhcpd to serve IP addresses out to our lab network 198.18.1.0/24. Comment out that section if you do not want or need DHCP on your lab network.
In this lab, the tig host is configured as 198.18.1.12/24 on the lab network. The management interface is setup as DHCP.
Grafana Setup and Dashboard
Now we go to the Grafana dashboard to see our lovely data. The first thing we need to do is add our Influxdb as a data source.
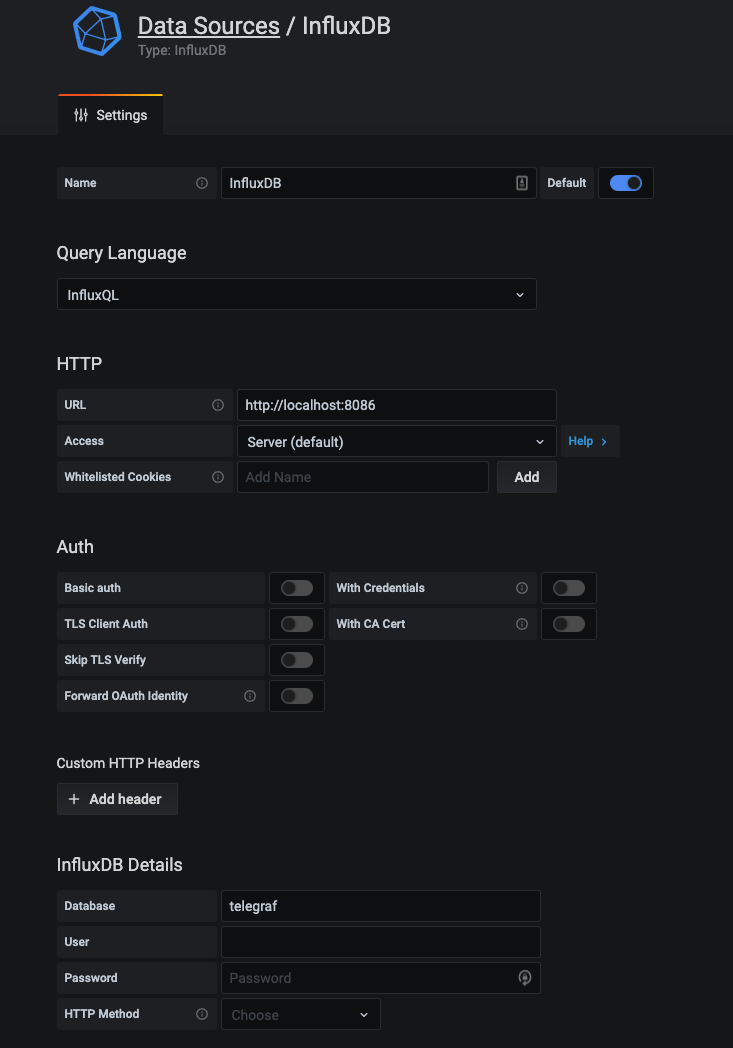
After adding our data source, we can add panels onto our example dashboard.
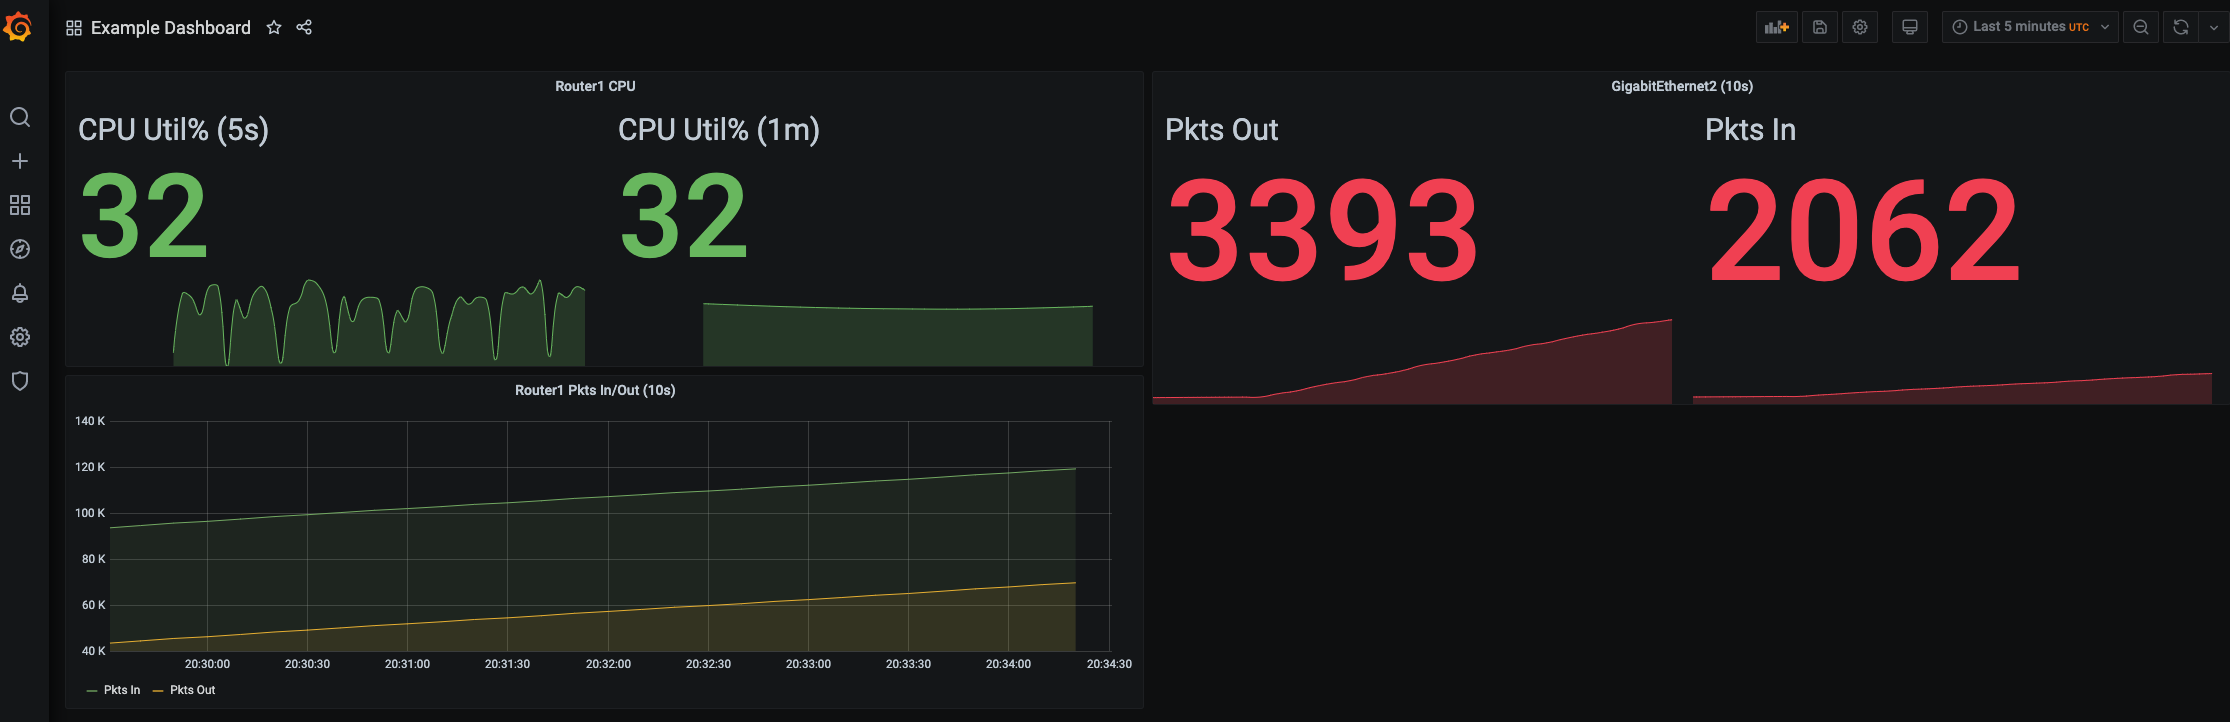
We have data! This is streaming telemetry from our router to our TIG stack. Our interval is set to every 5 seconds and we’re looking at a graph showing the CPU utilization every 5 seconds. That’s fast!
All Done, For Now
Thank you for taking a look at this demo! I’d also like to thank everyone who publishes resources on MDT, as I think this is an important capability to improve the observability of infrastructure.